Monitorix is an open source, free and most powerful lightweight tool designed to monitor system and network resources in Linux. It regularly collects system and network data and display the information in graphs using its own web interface.
It is written in Perl language and licensed under the terms of
GNU (General Public License) as published by the
FSP (Free Software Foundation). It uses
RRDtool to generate graphs and display them using web interface.
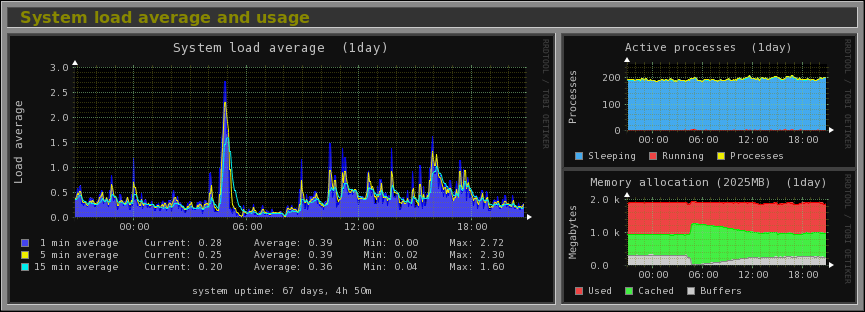
Monitorix Features* System load average, active processes, per-processor kernel usage, global kernel usage and memory allocation.
* Monitors Disk drive temperatures and health.
* Filesystem usage and I/O activity of filesystems.
* Network traffic usage up to 10 network devices.
* System services including SSH, FTP, Vsftpd, ProFTP, SMTP, POP3, IMAP, POP3, VirusMail and Spam.
* MTA Mail statistics including input and output connections.
* Network port traffic including TCP, UDP, etc.
* FTP statistics with log file formats of FTP servers.
* Apache statistics of local or remote servers.
* MySQL statistics of local or remote servers.
* Ability to view statistics in graphs or in plain text tables per day, week, month or year.
* Ability to zoom graphs for better view.
* Ability to define the number of graphs per row.
* Built-in HTTP server.
Installing Monitorix on a RHEL/CentOS/Fedora LinuxFirst, install following required packages.
# yum install rrdtool rrdtool-perl perl-libwww-perl perl-MailTools perl-MIME-Lite perl-CGI perl-DBI perl-XML-Simple perl-Config-General perl-HTTP-Server-Simple wgetIf in case yum fails to installing one or more of above packages, then you could enable following additional repositories to install them.
- Enable EPEL repository
- Enable RPMforge repository
Next, download the latest version of ‘Monitorix‘ package using wget command.
# wget http://www.monitorix.org/monitorix-3.4.0-1.noarch.rpm
Once successfully downloaded, install it using the rpm command.
# rpm -ivh monitorix-3.4.0-1.noarch.rpm
Preparing... ########################################### [100%]
1:monitorix ########################################### [100%]
Once successfully installed, please have a look at the main configuration file '
/etc/monitorix.conf' to add some extra settings according to your system and enable or disable graphs.
Finally, add Monitorix service to system start-up and start the service with following commands.
# chkconfig --level 35 monitorix on
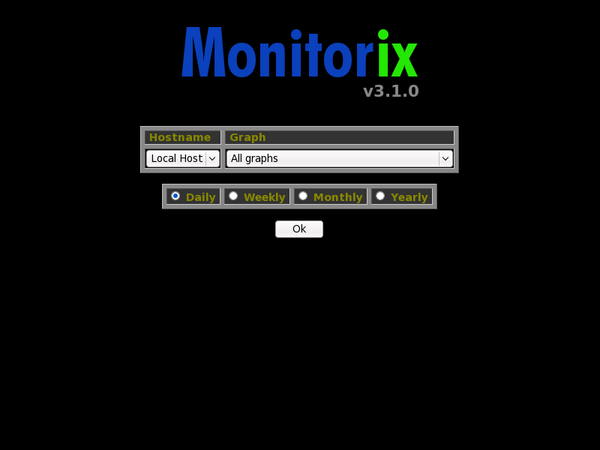
# service monitorix startOnce, you’ve started service, the program will start collecting system information according to configuration set in '/etc/monitorix.conf' file, and after few minutes you will start seeing system graphs from your browser at.
http://localhost:8080/monitorix/
Note: Turn Off SELinux, simple changing the line "
enforcing" to "
disabled" in '
/etc/selinux/config’ file.